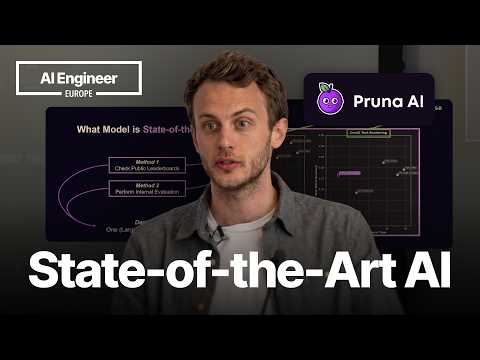
20 days of compute vs 7 hours: rethinking what…
Talk by Bertrand Charpentier (cofounder and chief scientist at Pruna AI) arguing that efficiency should be treated as a core dimension of state-of-the-art in AI, not a footnote. Using image-generation model evaluation as an example, he compares a full-scale benchmark of 26,000 battles (about 20 days of compute, $5,000) with the same evaluation on a fast compressed model (7 hours, $265). He contends no single model holds the "state of the art" title: leaderboards disagree, with the same model ranking differently across them, and most models lose 40% of head-to-head battles, suggesting the top-ranked model is suboptimal for nearly half of use cases. His proposed approach is Pareto-front analysis — plotting quality against latency or cost — which surfaces tight quality clusters with up to 20x efficiency differences and tends to favor small specialized models over large foundation models.
# Observation Document: Channel Presentation Evidence
## Video Overview
- **Title:** "20 days of compute vs 7 hours: rethinking what state-of-the-art means — Bertrand Charpentier, Pruna"
- **Format:** Live conference/talk presentation with audience interaction (preference polls, Q&A at the end) — evidenced by "how many people in the room prefer the first image" and "if there are any questions, happy to take them."
## Intended Audience
- **Practitioners selecting AI models for production or research**, not beginners: the talk assumes familiarity with leaderboards, Elo scores, CLIP scores, and internal evaluation pipelines.
- **Developers/researchers in image and video generation** specifically: examples center on image editing models, denoising steps, and text rendering metrics ("People just do manual inspection... in the image and video generation research").
- Evidence: "for our applications in research or when we deploy a product, we want always to have... the best performance out of our models."
## Claimed Scope
- The talk addresses **how to determine which AI model is state of the art**, arguing the answer is task- and efficiency-dependent: "there are multiple state of the art model[s]."
- Covers two evaluation methods: public leaderboards and internal benchmarking, with critiques of both (inconsistent rankings, low sample sizes, biased manual inspection, noisy metrics).
## Explicit Self-Description (Creator Claims)
- The speaker **works at Pruna** (title metadata; "this is what we are doing at Puna [Pruna]").
- Claims Pruna builds **"performance models... served behind endpoints,"** including "the fastest for example image models, video models that can run between 1 seconds to 5 seconds."
- Claims **open-source contributions**: "a package to show you how to compress your models on your own" and materials on efficiency research.
- Claims a collaboration: "We worked with BFL for this" (optimizing Flux models for text rendering).
- Claims an internal fast image editing model: "a model that we've done that does like time generation editing of images in less than 1 second."
- Claims operational scale: "For some of our models that we have, we have millions of friends [inferences] per day."
## Observable Presentation Patterns (Demonstrated, Not Claimed)
- **Data-driven argumentation style**: cites specific leaderboards by name (LM Arena/Arena, Design Arena, Artificial Analysis), specific figures ("26 K evaluations... 20 days of compute... 556 kW hour... $5 K"), and comparative numbers (7 hours, $265).
- **Interactive/engaging delivery**: live audience polls on image preferences; a relatable analogy comparing compute energy to marathon running ("400 marathons just to generate all these images").
- **Promotional framing woven into technical content**: the efficiency comparison (20 days vs 7 hours) contrasts a third-party model against a Pruna model, positioning the company's offering favorably.
- **Technical depth in Q&A**: detailed answer on compression methods — quantization, pruning, distillation, caching of denoising steps ("instead of doing like 50 times the computations... you can do it way less").
- **Positioning toward open source**: repeatedly points to open-source tools and educational materials as part of the channel/company's offering.
## Notes on Distinguishing Claims vs. Demonstration
- Speed, cost, and energy figures for Pruna's model are **creator claims** presented in the talk; no independent verification is present in the material.
- The critique of leaderboards and metrics is **demonstrated reasoning** supported by described (but not shown to the viewer) leaderboard and metric data.
# Delivery Observation: Bertrand Charpentier — "20 days of compute vs 7 hours"
## Overall Tone
- **Conversational and informal**, with filler words and loose syntax: "So, today we going to try to ask us to to ask us the question."
- **Live-talk register**, including room interaction: "So here I'm just going to show like three images... Who prefers the second image? Okay, couple of people."
## Vocabulary & Recurring Phrases
- **"So" as a sentence opener** — extremely frequent, appearing at the start of many segments: "So, we'll just try to see...", "So, the first method again is...", "So, here this is Chat pretty image."
- **Repeated key terms**: "leaderboard," "use case," "ranking," "Pareto front," "state of the art," "evaluation," "models."
- **Hedging vocabulary**: "I guess," "I think," "probably," "maybe," "a bit," "kind of":
> "I think the prompt was like probably a man eating some soup with pasta we with pasta or something like this."
> "And this is also some leaderboards from like uh design AI, I guess."
## Teaching Habits & Structure
- **Problem–solution framing**, stated repeatedly: "The problem is that...", "Another problem is...", "So there are a couple of problems with this and we can start this with a little game."
- **Interactive audience demonstration** to make a point about bias:
> "Who prefers the first image? ... Okay. So what is great here is that we have seen that people have different preference."
- **Quantitative anchors with vivid analogies**:
> "it represents 400 marathons just to generate all these images... I'm tired after one marathon, so I don't want to do 400 for sure."
- He returns to the analogy for contrast: "instead of running 500 500 marathons, I just need to run four marathons. So, if three of you want to run a marathon with me, it should be enough."
- **Named concrete tools/leaderboards** as evidence: "Design Arena," "LM Arena, now called Arena," "Artificial Analysis," "CLIP score."
- **Explicit takeaway slide recapped verbally** near the end:
> "I just listed a couple of takeaways which are like evaluate on many samples. You look at the user use case conditions. Use multiple benchmarks or efficiency which are key things..."
## Communication Patterns
- **Self-corrections mid-sentence**, visible throughout: "to to ask us," "the the the the manual inspection," "500 500 marathons," "1,000 100 and 1,200."
- **Delegating trust to slides when detail is unreadable**:
> "So, here maybe it's a bit small, but you can trust me."
> "So, this is a bit small, but you can trust me."
- This exact formula appears twice — a stable pattern.
- **Concession-then-pivot structure** ("it's good, but..."):
> "In general, it's like kind of a good solution... But the problem is that um you don't know exactly a lot of things..."
> "human evaluation is usually great, but you have to scale it um properly."
- **Rhetorical question then answer** for the core thesis:
> "So, to the question what model is state of the art, the answer is there are multiple state of the art model."
- **Light humor and self-deprecation** ("I'm tired after one marathon") used to humanize statistics.
- **Company plug at close**, transitioning from teaching to pitch: "And how to reach like state of the art models in general? Like this is what we are doing at Puna."
## Stability vs. Isolated Moments
- **Stable patterns** (high repetition): "So" openers, problem–solution framing, hedging, numeric comparisons, live audience polling.
- **Isolated moments**: the marathon energy analogy, the "you can trust me" slide aside (repeated once, thin evidence for a habit), and the joke inviting three audience members to run a marathon.
- **Uncertainty note**: no curated metadata was supplied, so observations rest solely on the transcript; some delivery cues (gesture, pacing, slide transitions) are only inferable from speech, not directly observable.
# Observation Record: "20 days of compute vs 7 hours: rethinking what state-of-the-art means"
**Speaker:** Bertrand Charpentier, Pruna (identified via curated metadata/title)
## Core Question
- "What AI model is state of the art?" — framed as important for research and product deployment, but a **confusing concept** where people have different visions.
## Two Common Methods for Identifying SOTA
### Method 1: Public Leaderboards
- Example workflow: for image editing, find a leaderboard (e.g., **Design Arena**), pick the top model (e.g., **ChatGPT image**).
- Speaker's assessment: "in general, it's like kind of a good solution... a first reasonable model at low effort" — but suboptimal.
**Problem A: Leaderboards disagree**
- Three leaderboards (LM Arena / "Arena", Design Arena, Artificial Analysis) rank image editing models differently; the top model differs.
- Example given: model "Human" ranked ~10 on Artificial Analysis vs ~5 on Arena.
- Duplicate entries and models absent from some leaderboards add noise.
- Elo score ranges differ across leaderboards (e.g., ~1,100–1,300 on some, different ranges on others), making relative strength unclear.
- Recommended response: consult multiple leaderboards; large ranking differences suggest approximately equivalent models.
**Problem B: Aggregated scores hide use-case-specific performance**
- Use-case-specific leaderboards (removing objects, changing background, editing text) show "completely different" rankings.
- "ChatGPT image is never top one in this in this ranking."
- Attribution by speaker: models trained more on specific tasks outperform there — "there is no model consistently outperforming the others."
- Recommended response: match leaderboard to your target use case.
**Problem C: Limited statistical significance**
- Leaderboards built on a few thousand samples — "probably super low" compared to application-scale inference. Speaker cites Pruna models with "millions of friends [inferences] per day" providing more signal from the API itself.
- Win rates: no model approaches 100%; most lose at least ~40% of battles. If your use case falls in that 40%, "you will just take the wrong model."
- Recommended response: average on more samples; evaluate close to final use-case conditions.
### Method 2: Internal Benchmarking
- Common approaches: **manual inspection** (a few prompts, intuitive feeling) or running **automated benchmarks** and selecting the highest-scoring model.
**Problem A: Manual inspection is doubly biased**
- Live audience poll on three images (prompt ~"a little guy and a parrot"; second round ~"a man eating soup with pasta"): audience preferences split across images, and some people changed their minds between rounds.
- Models were: **Seedream/Sid V model** (left), **Flux 1** (middle), and a Pruna-developed model (right).
- Conclusion: you are biased by your own preference **and** by the small sample of prompts inspected.
- Recommended response: "never only trust manual inspection"; scale human evaluation properly.
**Problem B: Inconsistent automated metrics**
- Ranking 8 models by **CLIP score** across different datasets: rankings "changed all the time"; variation between models is tiny relative to the metric range.
- Contrast: **task-specific metrics** (e.g., text-rendering metrics) produce consistent rankings (image model first, P image second) with larger, more meaningful variations.
- Recommended response: understand what a metric actually measures; use multiple metrics matched to the use case.
### Cross-cutting Problem: Quality Is Driven by Compute
- Case study: ChatGPT image on Design Arena/LM Arena (speaker uncertain which): ~26K battles, ~62 seconds per image.
- Totals cited: **20 days of compute**, **~$5,000**, **~556 kWh** — energy equivalent (via speaker's Strava marathon data) to **400 marathons**.
- Alternative (Pruna's fast image editing model, <1 second/image): **7 hours**, **$265**, equivalent of **4 marathons**.
- Claim: quality gains from large models are sometimes "not worth the efficiency... the compute cost."
## Speaker's Answer to the Core Question
- "There are multiple state of the art model[s]" — not one.
- Preferred tool: **Pareto plots** (efficiency on x-axis — latency or price; quality score on y-axis; Pareto fronts in red).
- Observation: 3–4 models on the front; quality scores cluster (~1,100–1,200) while efficiency differs up to **~20x faster**.
- Task-specific Pareto fronts (e.g., text rendering) enable further optimization; speaker notes Pruna worked **with BFL** on optimized Flux 2 / Flux 2 Flex models that remain on the text-rendering Pareto front at much higher speed.
## Takeaways (as stated)
- Evaluate on many samples.
- Look at user use-case conditions.
- Use multiple benchmarks; **efficiency is key**.
- Conclusion: benchmarking "is not dead" — done properly, it typically points to **many small performant models**, not a large foundational model.
## Pruna Positioning
- Builds "performance models" served behind endpoints; image/video models running **1–5 seconds**.
- Open-source contributions: a package to compress models, materials on efficiency research papers, "efficiency cost" resources.
## Q&A Response (compression methods)
- **Quantization** — per-module differentiated quantization ("super important").
- **Pruning** — removing unimportant components.
- **Denoising step reduction** — typically 20–50 steps reducible to ~20 or even ~4 via **distillation** or **caching methods**.
- Open-source caching algorithms in their package plus internal algorithms behind their endpoints.
## Qualifications & Uncertainties Preserved
- Speaker expresses uncertainty about which leaderboard ran the 26K-battle evaluation ("Design Arena, I think or maybe it's LM Arena").
- Repeatedly hedges on figures ("you can trust me", "I guess", "approximately").
- Manual inspection is framed as useful for intuition but insufficient — not rejected outright.
# Speaker Attribution & Provenance Record
## Video
- **Title:** 20 days of compute vs 7 hours: rethinking what state-of-the-art means — Bertrand Charpentier, Pruna
- **Video ID:** `01a15ca9-163c-72b4-873c-749de1a184f5`
## Speakers & Roles
| Speaker | Role | Evidence |
|---|---|---|
| **Bertrand Charpentier** | **Creator / primary presenter** | Title attribution; delivers the full talk, states "this is what we are doing at Pruna" |
| **Unidentified audience member(s)** | Audience participants | Raise a question at the end ("then you have a question?"); answer responds to compression methods |
| Audience members (in-room) | Poll participants | Vote on image preferences during interactive "little game" segments |
- **Narrator:** None present.
- **Curated metadata:** Not supplied beyond title; speaker identity established by title attribution only.
## Promotional Segments (Flagged)
- **Pruna promotion** (closing): presenter describes Pruna's "performance models served behind endpoints," claiming "fastest image models, video models that can run between 1 seconds to 5 seconds," open-source contributions, and a compression package.
- **Company model promotion** (mid-talk): "with some models we developed... one image" and a fast image editing model ("less than 1 second", "only 7 hours", "$265") compared against ChatGPT image's "20 days" / "$5K".
- **Partner mention:** "We worked with BFL for this" regarding optimized flux two / flux two flex models.
## Referenced Sources & Third-Party Claims
- **Public leaderboards cited:** LM Arena ("now called Arena"), Design Arena, Artificial Analysis.
- **Third-party models named:** ChatGPT image, Seedream ("Sid V" per transcript), Flux one, Flux two / Flux two flex, "Human" model, "P image".
- **Metrics/benchmarks referenced:** Elo scores, win rates, CLIP score, text-rendering metrics.
- **Quantitative claims (speaker-attributed, unverified):**
- ChatGPT image evaluation: 26K battles, ~62 seconds/image, 20 days compute, $5K, ~556 kWh ("400 marathons" analogy via speaker's Strava).
- Pruna model: 7 hours, $265, "four marathons."
- **Third-party attribution uncertainty:** Speaker says of the evaluation figures, "Design Arena, uh I think or maybe it's LM Arena" — source of the 26K-battle figure is **explicitly uncertain**.
## Availability & Limits
- **Comments:** No comment availability information supplied.
- **Q&A:** One audience question partially captured (compression methods); question text itself not transcribed — answer implies topic.
- **Visuals referenced but unavailable:** Slide-based data (leaderboard comparisons, Elo rankings, Pareto plots, CLIP score tables) is described, not shown; speaker repeatedly notes "this is a bit small, but you can trust me."
Hello. So, today we going to try to ask us to to ask us the question what AI model is state of the art. And I guess this is a super important question for everyone because of course for our applications
in research or when we deploy a product, we want always to have the the best performance out of our models. But the problem is that state of the art is a bit a confusing concept and people maybe have different vision on this. So, we'll just try to see a bit like first what what how people approach this question and how they try to answer this question. And usually there are two main methods that people try to to use to know what new model is state of the state of the art. The first one is simply, you know, they go on the internet and check some public leaderboards, see what what is the best model on on the public leaderboard. And another method is actually just perform some internal evaluation. And again see based on their internal evaluation like what model is the best. The problem with these methods is like in most cases if you apply them naively, you will always find like a kind of lazy solution which is just to to use a large foundation foundation model. So, we're going to just try to see a bit with these methods like what people try uh tend to do like a bit um quick and can can can be done better. So, the first method again is like just simply checking a public leaderboard. So, for example, if you take the use case of like uh image editing, let's try to find the best image editing model in this case. So, usually the first step is just find some leaderboard. In this case, you can use like Design Arena which is a very famous one. And then you just pick the top one which is ChatGPT image. And then you feel that you are happy. This is the best model for your use case. In general, it's like kind of a good solution. Like you get like a the first reasonable reasonable model at low effort. But the problem is that um you don't know exactly a lot of things about how the users will interact with your model and so on. So, you can actually make a much better choice. So, the first problem is that if you look at many leaderboards, but not a
single one, you will see that each public leaderboard will have a different ranking. So, here maybe it's a bit small, but you can trust me. There are three leaderboards, LM Arena, now called
Arena, Design Arena, Artificial Analysis, and they try to rank image editing models. And if you try to draw a bit the difference between the this leaderboards, you will see that it's not the same ranking. Like the top model is not the same. Also, like relatively, if you compare model two video between each other, they will be different. For example, there is one model, Human, that goes from rank 10 on Artificial Analysis and is ranked five on like Arena. So, the idea is that each leaderboard has a different perspective, and sometimes there are also some models that have duplicate entries. So, it's a bit noise, a bit what is the information you want to get out get out of it. There are even some models that appear in the leaderboards and they are not in some others. So, it's hard to get the main information. And when you check actually in details like the Elo scores, so which is supposed to be the quality scores you use to know what is the best model, you will see that even these Elo scores, they are very different, meaning that for some for some leaderboards, it will be between 1,100 to 1,300, but for some it will be completely different range. So, relatively, models, we don't know how strong they they between each other. And usually, the main solution for this is not to trust a single one, but you really to look at multiple one. And when you see that there is a lot of difference between like different rankings, it means that probably there are like some models which are approximately equivalent. It's not because ChatGPT image is ranked top top one on one on one leaderboard on the leaderboard that it means that it's the best overall. Another problem is in most cases you will have applica you will release and use your model for specific application. What we've seen before is like some aggregated score over a lot of different task. I don't know. Uh for example, we we can see like removing objects, changing background, editing text. But we can actually build some leaderboards for each of the specific use case. And this is also some leaderboards from like uh design AI, I guess. And
I think there is a problem with the Okay. It comes back. Um and you can see that actually, if you draw the difference for each specific use case, you will see that again the ranking they are completely different.
And ChatGPT image is never top top one in this in this ranking. There are always some new model and some models which are super good at removing objects, some models which are super good at doing some other things. That is there is no model consistently outperforming the others. And uh there are very different models working well for the for different target use cases. And this is normal because this is just due to to the fact that, you know, some models they have been, you know, for example, trained more on some specific task than others. And the solution for this is when you check like public leaderboard, you should always try to target what your use case will do in the end. Like if you focus on removing objects, look at this leaderboard and not the others. Another problem is that usually leaderboards they are not really statistically significant for your specific use case. So, here I try to show two two different things. So, the first thing is on how many samples these leaderboards are built. And if you check on the left, for example, artificial analysis, this is all these different things they are built on, you know, few thousand samples for each of them. So, it's not much if you compare to the the load of inference you have for many applications, it's probably super low. For some of our our models that we have,
we have millions of friends per day, so probably we'll get more information by just like just training the model on our API rather than just looking at this at this leaderboards.
Another thing is yellow scores. Usually, you can also compute what is the win rate of each model. So, when you build these these rankings, what you what you do is you actually make models battle against each other and ask people, "Okay, what is the best What is the best model between the the two two two a lot of users?" And what you can see is actually the win rate usually there are no models which are close to 100% win rates. It means that most of the models they lose at least 40% of their of their battles. And if your use case is in this 40% of the battles, it means that you will just if you take the best models, you will just take the wrong model. So, again here it's important really to average on more samples and always like have like evaluation which is close to the final setup the final use case conditions. Now, we can check also the second solution to to to try to know what is the state of the art for AI model. And the second solution is to do just internal benchmark. One way to do it is what I see the most actually in the image and video generation research and so on. People just do manual inspection. They try a couple of prompts, a couple of models, and they they get a feeling intuitively a bit what is the best model. Another thing that sometimes people do is they just like run some benchmark automated benchmark out there and then try to see okay, based on this
benchmark, which is the one that that has the best performance. So there yes, basically then you you just select the preferred model. So it can be I don't know for example the third model or the one with the highest score.
The problem is that So there are a couple of problems with this and we can start this with a little game. So here I'm just going to show like three images. And maybe one question for you is how many people in the room prefer the first prefer the first image among these three? So the this is a question like in general you can ask a lot of questions. So does it adhere the prompt? Is the what image do you prefer and so on? But the prompt was I I think a little guy and a parrot or something like this. And yeah. Okay, first. Who prefers the second image? Okay, couple of people. Who prefers the third image? Okay. So what is great here is that we have seen that people have different preference. So it's important to see that if you do like manual inspection, you will be super biased to your own preference. So it's very important to not trust on your preference because then you have big surprise that actually it's not the the models that are preferred by by everyone. Now we can do it again. Same question, who prefers the first image in this case? I think the prompt was like probably a man eating some soup with pasta we with pasta or something like this. Okay. Who prefers the second image? Okay, great. And who prefers the third? Okay. So, that's also super interesting because I've seen some people changing their minds. So, always on the left it was the the the Sid V model, middle Flux one, and uh on the right like uh with some models we developed one image. And the idea is like also you are super biased toward the few samples that you look at. So, when you do manual inspections, you are two times biased by you and by also
the number of samples the specific samples you you look at. So, so in general, the idea is like you should never only trust the the the the manual inspection. It's good to get a
feeling, but it's not enough. You should always ask many people uh to do it, and human evaluation is usually great, but you have to scale it um properly. Another problem is that when you do not human evaluation, but more like proper like uh automation evaluation with uh with metrics, sometimes you have like non-consistent results. So, for example, this is a bit small, but you can trust me. We ranked like eight models regarding some metrics like a very standard metric which is called CLIP score, and sometimes people when they try to evaluate image models they they check this metric first. And you can see actually that if you check like the rankings for uh the three metrics we looked like CLIP score on different datasets, it changed all the time. And these metrics are supposed to be between zero and zero and one or zero and 100, and actually the variations between models they are super small. So, it means it means that it's hard to know from this metric what is the best model. What you should do is actually first having some clear understanding of what the metric does, and also use multiple multiple of them. So, here for example, this is another type of metric. When you know you you know your use case. For example, you know to you you know you want to be the best at text rendering. You there are a lot of text rendering metrics that would be better to evaluate your models. So, here you can see again like the ranking is way more consistent. You have always the image being the first and P image being the second model. And also the variations, they are way more significant. So, the models are supposed to be zero uh the metrics are supposed
to be between zero and one. And there are like clear difference uh between like every every model. So, yes, in general, very important understanding metrics.
People usually tend to just use some metrics and see, "Okay, I did my benchmark and then I stop here." But it's important to understand what you actually measured with this. And now a a last problem, which is actually common to the the first and second method to that we that we've seen before is that usually quality is driven by compute. So, here this is Chat pretty image. And for their evaluation, uh Design Arena, uh I think or maybe it's LM Arena. Um they did like 27 uh 26 K battles. So, it means they generated 20 um 26 K images. And each of this image takes 1 minute to generate. So, here I summarized all this information. Si- 62 seconds. Uh 26 K evaluations. And in total to do this 26 K evaluations, it takes 20 days of compute. In terms of cost, it's 5 K just 5 K just to to to run this evaluation. And in terms of energy, it's approximately, you know, 556 kW kW hour. So, I know that people might not have the order of magnitude of what it represents, this amount of energy. So, just to give like some idea, I checked my Strava and checked how much energy I was consuming by running a marathon
and actually it represents 400 marathons just to generate all these images. So, it's a lot. I'm tired after one marathon, so I don't want to do 400 for sure.
Now, there are some alternative. You can use some different models. So, of course this is a model that we've we've done that does like time generation editing of images in less than 1 second. And for the same amount of evaluation, it takes only 7 hours. It takes also like it uses also way less money, so 265 dollars. And instead of running 500 500 marathons, I just need to run four marathons. So, if three of you want to run a marathon with me, it should be enough to to to do this. So, again the idea is like people tend to just look at quality, but it's important not to look only at quality, but also at efficiency because sometimes the the additional gain you get with quality is not worth the efficiency the the the compute cost. So, to the question what model is state of the art, the answer is there are multiple state of the art model. And the tool I prefer for this is usually the Pareto plots where basically on the x-axis you have one efficiency metric. For example, on the left it's latency for the generation of an image. On the right it's the price for the generation of an image. On the y-axis you have some quality score, let's say the L score. And here you can draw the Pareto fronts in red and you can see that there is not one single state of the art model, but there are actually multiple of them and there are like three or four. And you can see that even though the quality score is not there is no big variations, it's always always between 1,000 100 and 1,200, there is a big difference in terms of efficiency. So, you can be like really like times times I don't know, 20 times faster just by using the different model. Even better, if you know the specific task you want to do, you can do it like the Pareto front not with quality metric which focuses on general general capability, but really based on quality metrics which is for
the target use case. So, this is some Pareto fronts focusing on text rendering. And here for example, we optimized a lot like the flux two model or flux two flex models. We worked with
BFL for for this. And you can see that you can get way faster. You can still be on the Pareto front for the specific use case of text rendering. So, is benchmarking dead? The idea is it's not dead. We can do it properly and get a lot of useful information out of it. Yes. And if you use it in a better way like by taking all these you know rules when using the evaluation, you will usually usually not find a large long way a large foundational model, but more like a lot of small performance models that will be very good for your use case. So, I just listed a couple of takeaways which are like evaluate on many samples. You look at the user use case conditions. Use multiple benchmarks or efficiency which are key things to keep in mind when evaluating models. And how to reach like state of the art models in general? Like this is what we are doing at Puna. We are actually building a lot of what we call performance models with that are served behind hand point hand points. We have the fastest for example image models, video models that can run between 1 seconds to 5 seconds. And but we also try to give a lot to the open source with a lot of open source contributions with the package to show you how to compress your models on your own. Also a lot of materials on all the best research papers for efficiency or even like some efficiency cost. So, thanks for your attention. I think you are out of time, but if there are any questions, happy to take them. Okay, perfect. Then you have a question?
Uh sure, so actually there are multiple like I mean, you know it as well, there are a lot of family of compression methods. So, of course you can guess like quantization things we do a lot,
and we do it a different quantization for every specific module in the in the model, which is super important. Uh we can do also some pruning where we just remove some components which are not important. And uh for all these image and video models, something that works quite well is working on the step that the the denoiser um like when you generate a video or an image, you usually use like 20 to 50 steps to generate like um uh the the content, and you can actually reduce it a lot either via distillation of or caching methods. So, you can instead of doing like 50 times the computations using the same backbone, you can do it way less, I don't know, 20 times or even like four times, depending on how aggressive you want to be. Uh So, we have a like in our package, we have a lot of open source uh algorithms for good caching. Uh but we have also some internal, you know, algorithms that we have for the models we serve behind the the endpoints. But uh yeah, there are really advanced caching methods and so on, but yeah. Sure. Thanks. Okay, then