Every Building Is a Balance Sheet: Spatial Memory for…
Jordi Spranger (Spranic) presents the concept of a spatial memory for buildings: capturing a space with an off-the-shelf sensor so each walk through a building becomes a queryable record of its objects, relationships, and changes over time. Repeat visits align along a timeline, so changes (such as chairs moving between two kitchen scans) can be queried against the captured scene with a reference back to the observation. Spranger frames the problem around the gap between frequently updated financial records and infrequently updated knowledge of the underlying buildings. Maintenance, interior design, robotics, and insurance are proposed downstream uses; these are proposed applications rather than demonstrated deployments or measured results. The practical demonstration is the narrower one: preserving scene observations, comparing visits, and making spatial evidence queryable. Timestamps cover the talk's structure, from framing the problem to kitchen-scan examples and proposed workflows.
# Video Identity Observations
## Video Overview
- **Title:** *Every Building Is a Balance Sheet: Spatial Memory for Real-World Assets — Jordi Spranger, Spranic*
- **Format:** Conference talk delivered at **AI Engineer NYC 2026** ("I'm very excited to give this talk today at AI Engineer NYC 2026").
- **Creator affiliation stated in-transcript:** Founder of Spranic, presented as a **collaboration between Spranic and Neo4j** (with credit to Neo4j collaborator "Zaeem"). Website given at close: **spranik.com**.
## Intended Audience
Observable evidence points to a **technical/professional audience**, not general consumers:
- The venue itself (AI Engineer conference) and framing around a **graph database** ("Neo4j is a graph database... based in Sweden, Malmö") suggest developers and AI/data practitioners.
- Technical terminology used without explanation: *"semantic meaning," "graph database," "AI-ready data asset," "change detection," "digital twin."*
- Business/industry framing aimed at stakeholders: **property managers, insurers, lenders** — e.g., examples of premiums adjusting "by the performance of the upkeep of the property" and "hyper-individualized insurance."
## Claimed Scope
- The channel/speaker claims a focus on **real estate as a data problem** at global scale: *"The largest asset class on Earth is real estate and it's about 400 trillion globally in size."*
- Core thesis claimed: *"What would it take to make a building as queryable as a ledger?"* — positioning buildings as **queryable, AI-ready data assets**.
- Demonstrated product scope (shown, not just claimed): smartphone/sensor walks producing scans, object recognition, time-aligned walk comparison, natural-language Q&A against maps ("Where can I heat myself?"), and delta/proof-of-change outputs.
- Claimed downstream applications: **maintenance, compliance checks, insurance underwriting, interior design, robotics/digital twins** — asserted as possibilities, with insurance statistics (Kroll 70% underinsured; "one in three commercial buildings... wrong construction class") cited as market motivation.
## Self-Description Evidence
- **Company origin claim:** Spranic "was founded in June 2026."
- **Positioning claim:** Real estate records are a "black box... based on some pictures and some PDFs," and AI can make the asset class "much more transparent."
- **Closing call-to-action:** direct viewers to the founder's website, indicating a **product/company-oriented identity** rather than pure educational content.
## Claims vs. Demonstrations
- **Demonstrated:** live walk-through scans, map generation, chat-based map queries, and change detection between two passes.
- **Claimed but not demonstrated:** insurance premium outcomes, the "70% underinsured" causal explanation ("my read is..."), robotics integration, and the "$4 trillion US commercial mortgages" impact framing.
## Distinguishing Note
This single talk suggests (but does not confirm) a channel identity centered on **AI applied to real-world physical assets** — combining technical demos with market-size business cases. Channel-wide scope cannot be concluded from one video.
# Delivery Observation — "Every Building Is a Balance Sheet" (Jordi Spranger, Spranic)
## Overall Impression
A founder-style technical talk combining market framing, a product walkthrough, and a business case. Delivery is conversational and demo-driven, with frequent verbal disfluencies.
---
## Tone
- **Conversational and informal**, with natural spoken pauses and fillers: *"um"*, *"uh"*, *"yeah"* appear throughout (e.g., *"Um and so, now what is it that a record has to answer?"*).
- **Enthusiastic at the opening and close**: *"Hello. I'm very excited to give this talk today"* and *"Thank you very much."*
- **Casual asides while presenting demos**, speaking as if narrating live: *"That was me uh going through a conference hall."*
---
## Recurring Vocabulary and Phrases
Several terms repeat across the talk, forming its core lexical frame:
- **"Hyper-personalized"** — recurs multiple times in close succession: *"hyper-personalized insurance policy"*, *"hyper-individualized insurance"*, *"hyper-customized market"*.
- **"Walk" as a noun/verb for capture** — the most distinctive repeated term: *"every walk becomes a memory"*, *"the whole walk or the whole scan"*, *"you just walk the space"*, *"as you walk it again at renewal"*.
- **"Delta"** — used repeatedly for change detection: *"what's the delta between them?"*, *"you now see the delta and the upkeep"*.
- **"AI-ready"** — *"an AI-ready asset"*, *"a building that is an AI-ready data asset"*.
- **Financial-ledger framing** — *balance sheet*, *ledger*, *book*, *books* used as a persistent metaphor: *"make a building as queryable as a ledger"*, *"while the book closes so many times"*.
---
## Teaching Habits
- **Big-number framing first**: opens with market scale — *"about 400 trillion globally in size"* — then breaks it down (*"residential... around 300 trillion. Then... commercial is around 60 trillion"*).
- **Problem → demo → capability structure**: the "gap" (quarterly books vs. stale building data) is established before any product appears.
- **Rhetorical question as pivot**: *"So the question, what would it take to make a building as queryable as a ledger?"* marks the transition from problem to solution.
- **Concrete narrated examples over abstraction**: the radiator example (*"Where can I heat myself?"*) and the displaced chairs (*"these three chairs in the middle have been displaced"*) demonstrate capabilities via specific queries.
- **Statistic-heavy persuasion in the business section**: *70% underinsured*, *one in three wrong construction class*, *35% hurricane premium deduction*, *73% of insurers* — cited in rapid succession.
---
## Communication Patterns
- **Self-referential demos**: repeatedly identifies himself as the person in the scans — *"That was me uh going through a conference hall"*, *"this is just me walking through a kitchen captured twice"*.
- **Hedged sourcing**: cites third-party data but flags uncertainty — *"according to Kroll... why exactly that is, um I don't exactly know. It didn't conclude. But my read is that..."*
- **Repetition as emphasis**: doubles words for stress — *"very re-realistic time frame"*, *"dispersed and intransparent"* (the transcript also shows repeated words like *"to each to each property"*).
- **Metaphor persistence**: the ledger/black-box metaphor is introduced early (*"there's really a black box or maybe something that is based on some pictures and some PDFs"*) and returned to at the close (*"it really needs to be transparent"*).
- **Closing call to action**: ends with a website pointer — *"please visit my website spranik.com"*.
---
## Uncertainty Notes
- Single talk; no cross-video evidence, so all patterns above are **within-talk observations only** and repetition counts are based on this transcript alone.
- Tone judgments (e.g., "enthusiastic") rest on explicit spoken statements ("I'm very excited"), not inferred affect.
- Some statistics (Kroll study, insurer percentages) cannot be verified beyond how they are quoted here.
# Every Building Is a Balance Sheet: Spatial Memory for Real-World Assets
**Speaker:** Jordi Spranger (founder, Spranic) — talk at AI Engineer NYC 2026, presented as a collaboration between Spranic and Neo4j (with collaborator Zaeem on Neo4j's side). Neo4j is described as a graph database company based in Malmö, Sweden. Spranic was founded June 2026.
---
## Core Thesis
> "Every walk becomes a memory" — real-world buildings can be made "as queryable as a ledger" by repeatedly scanning them with off-the-shelf sensors and storing the observations in a graph database.
---
## Claims About the Real Estate Market
- **Real estate is the largest asset class on Earth**, ~**$400 trillion** globally — claimed to exceed global equities, debt, and gold combined.
- Residential: ~$300T; Commercial: ~$60T; Agriculture: ~$50T. The talk focuses on commercial.
- **The "gap" claim:** financial records (lending, insurance, mortgages) are updated quarterly, but the underlying buildings are only updated every few years — "maybe in year five is a very realistic time frame." Between updates, the building state is "a black box" based on "some pictures and some PDFs."
- **Kroll research (1,500 properties):** ~**70% of buildings are underinsured**. Spranger explicitly said the study "didn't conclude" why; his own reading is that records are old and not detailed enough for highly specified insurance. (This is presented as his interpretation, not a study finding.)
- The problem affects ~**$4 trillion in US commercial mortgages**.
---
## The Proposed System
- **Capture:** Anyone (e.g., property management) walks the space with an off-the-shelf sensor; a scan of a conference hall took "literally just walking through it" with the result ready "a minute later."
- **Recognition & storage:** Assets in the building are recognized and stored in a graph database with **semantic meaning**.
- **Temporal alignment:** Multiple walks of the same space are aligned on a time axis (e.g., "walk on Monday and a Monday next year or the next quarter"), producing a record of the space's evolution.
- **Why a graph:** graphs are "extremely flexible" in what information is gathered and connected, allowing per-property customization.
## What a Record Must Answer (framed as "ledger questions," not vision questions)
1. **What changed** — comparing two walks object-by-object and surrounding-by-surrounding.
2. **When it changed** — every observation captures its source/evidence.
3. **Who needs to know** — e.g., expired fire extinguishers or structural damage should trigger notification; insurers could adjust premiums based on upkeep performance ("hyper-individualized insurance").
---
## Demonstrated Capabilities (per the speaker's demos)
- **AI-ready asset / chat:** e.g., "Where can I heat myself?" → points to radiator; "Is there a glass or mug in the kitchen?" → points to glasses and mugs.
- **Change detection:** two passes of a kitchen identified three displaced chairs, with "ground source reference to the actual capture" as proof.
- **Downstream uses:** maintenance tracking, compliance checks, insurance, interior design, and robotics/digital-twin applications.
## Insurance Business Case (figures attributed to insurers/industry, as relayed)
- "Insurance pays for what it can verify."
- **One in three** commercial buildings is on the books with the **wrong construction class**.
- **35%** of buildings can get a hurricane-premium deduction if certified (compliance standards verifiable from the AI digital asset).
- **73%** of insurers agree they would see fewer hurricane-damage claims for checked/certified buildings.
- At policy start, an initial scan sets the property's state; at renewal, deltas in upkeep enable personalized premiums.
---
## Closing Position
Real estate "really needs to be transparent"; there is "a huge inefficiency happening" that AI-enabled insights could turn into "a really new hyper-customized market around assets." Website given: spranik.com.
---
## Qualifications & Tensions Noted
- The underinsurance explanation (old, under-detailed records) is **the speaker's own reading**, not a conclusion of the Kroll study, per his explicit statement.
- Benefits (premium deductions, fewer claims) are presented as potential business-case figures rather than measured outcomes of the system itself.
- Note: the talk and company founding dates (AI Engineer NYC 2026; Spranic founded June 2026) are as stated in the transcript.
# Attribution & Provenance Record
## Video Identification
- **Video ID:** `01a15ca6-7211-7629-aea2-950ccde388fb`
- **Title:** *Every Building Is a Balance Sheet: Spatial Memory for Real-World Assets — Jordi Spranger, Spranic*
- **Context:** Conference talk at **AI Engineer NYC 2026** (stated by speaker in transcript)
## Speaker Roles
| Speaker | Role | Basis |
|---|---|---|
| **Jordi Spranger** | Solo presenter; founder of **Sprana(nic)**; collaborator on the project with Neo4j | Stated in transcript ("I am the founder of"; "this is a collaboration between Sprana and Neo4j") |
- **No other speakers** appear in the transcript.
- The speaker demonstrates the product personally ("That was me uh going through a conference hall").
- He acknowledges a **Zaeem** as "the collaborator on Neo4j's side" — credited but not identified as speaking in this video.
## Affiliations & Relationships Declared
- **Sprana(nic):** founded by the speaker in **June 2026** (per speaker).
- **Neo4j:** described as a graph database company based in **Malmö, Sweden**.
- The talk is presented as a **collaboration** between Sprana and Neo4j.
## Referenced Sources & Third-Party Claims
- **Kroll:** research covering **1,500 properties**, finding **70% of buildings are underinsured**. Speaker notes the study "didn't conclude" the cause; his interpretation is his own read.
- **Insurance industry figures** (source not named beyond "insurers"):
- Impact on ~**4 trillion USD** in US commercial mortgages.
- **1 in 3** commercial buildings booked with the wrong construction class.
- **35%** of buildings could get a hurricane premium deduction if certified.
- **73%** of insurers agree they see fewer hurricane claims for certified buildings.
- **Market size figures** (no source cited): real estate ~**400 trillion** globally (residential ~300T, commercial ~60T, agriculture ~50T).
## Promotional Segments — FLAGGED
- **Product promotion:** The talk presents Sprana's walk-to-scan product and Neo4j-based graph storage throughout; the closing includes an explicit call to action:
> "if you want to find out more, please visit my website spranik.com"
- Speaker has a direct founder's interest in the product discussed.
## Evidence & Availability Limits
- No curated metadata beyond title supplied.
- No mention of comments availability, slides, links, or supplementary materials beyond the website above.
- Visual demonstrations (scans, chat queries, change detection) are referenced in the transcript but not independently verifiable from text alone.
- First-person narration throughout; no interview, Q&A, or guest segments present.
Hello. I'm very excited to give this talk today at AI Engineer NYC 2026. Um this is a collaboration between Sprana and Neo4j. Sprana, I am the founder of.
It was founded in June 2026. Neo4j is a graph database in based in Sweden, Malmö. And um a special thanks here at Zaeem, who is the collaborator on Neo4j's side. This is about every building is a balance sheet and the spatial memory for real-world assets. The largest asset class on Earth is real estate and it's about 400 trillion globally in size. And um this is more than global equities, debt, and gold combined. If we look on the right, you see a lot of squares. Each square is about 1 trillion uh in worth and you can see the residential part is the biggest. It's around 300 trillion. Then you can see the commercial is around 60 trillion and then agriculture around 50 trillion. And uh today we will focus more on the commercial side, but all of this um real estate is impacted by essentially a gap. And the gap is that our financial books uh where we have lending and insurances and um
mortgages, all of this is book kept um and this is updated every quarter. But the actual underlying assets, which is the real estate that they are based
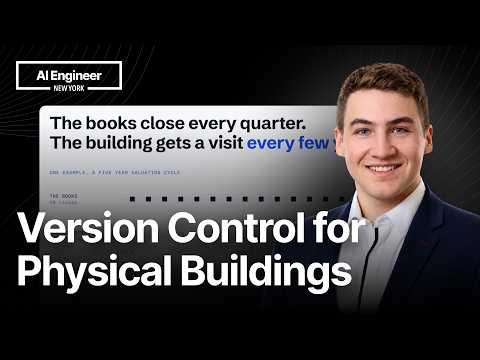
on, um they're not updated every quarter. In fact, they're only updated maybe every few years, maybe just before the financial instrument for the for the real estate is being created. And also maybe again once it needs a modification or a new financial instrument on top of it, maybe in in year five is a very re- realistic time frame. But between year zero and year five, you really don't have an update on the building state or the real estate state. So that means that while the book closes so many times, there's really a black box or maybe something that is based on some pictures and some PDFs about the building. And this is a real gap. Um and you can see it. So according to Kroll, um they did a research with 1,500 properties. Essentially, 70% of the buildings are underinsured. And why exactly that is, um I don't exactly know. It didn't conclude. But my read is that the the record is quite old and it's maybe also not as detailed. So the insurance is not very highly specified and really fulfilling the needs of the real estate. And \[snorts\] this impacts around 4 trillion US commercial mortgages. And um yeah, every one of them rests on the building. Uh so the question, what would it take to make a building as queryable as a ledger? And a ledger here can be give
you an answer in milliseconds. But a building today is giving you only an answer after a site visit. And even then, maybe in like some notes, PDFs, very
dispersed and intransparent, not unified. Um so this is where the idea comes in, where every walk becomes a memory. And how this works is you just take a off-the-shelf sensor, you walk the space, and you map it. And you can see it up there actually being created. That was me uh going through a conference hall. And the whole walk or the whole scan here took literally just walking through it. And a minute later, you had the scan. Um so you walk through the property, whoever that is, property management, etc., can be equipped with it. They map it. And \[clears throat\] as they map it, you get all the assets in the building being recognized and stored in a database, which is building below. This is the graph database. And so, this is then has a semantic meaning, which means we can really understand the space. And as we walk it again, both walks are kept. So, walk on Monday and a Monday next year or the next quarter. And these are now aligned on a time axis. So, we have a space, we know what's in the space, and we know the evolution of the space according to every every time we walk it and we measure it. And this is all kept as a graph. Graph have a bunch of technical benefits, but one of them is they're extremely flexible in what information you want to gather and how you want to connect it. And so, this can be hyper personal personalized to each asset to each to each property. Um yeah.
And so, now what is it that a record has to answer? So, these are not vision questions, they are ledger questions. You really want to know in a property or in the real
estate, what has changed? So, two walks of one space compare object by object and and surrounding by surrounding. You also want to know when it has changed. So, every observation carries and captures where it came from. And you also want to know who needs to know information or deltas that have happened that we have now observed. So, when you find something with evidence, for example, structural damages or maybe for fire insurance that fire extinguishers are off off Yeah, they have expired, then you need to know that and you need to be informed and counteract on it. Or maybe the insurance can know and they can increase their premiums by the performance of the upkeep of the property. So, hyper-individualized insurance. Um and here's really how it looks. So, this is just me walking through a
kitchen captured twice, once on the left and once on the right. And you can see you just walk the space, you directly get the map, and um
and as you walk the same space, they're being recognized as the same space, and you can align them between um the same space in the time period A and the time period B, and you have a timeline. And once you have a map, you can now use it as an AI-ready asset, which means that you can chat with it, you can talk with it, you can ask questions against it. For example, here I ask, "Where can I heat myself?" And in the map, the answer is being given to the radiator. Or, "Is there a glass or mug to drink from in a kitchen?" It It points you to the glasses and mugs in the kitchen. Um so, this is very powerful because it makes the map from pixels into something we can work with. Um and now also the change detection. So, this were two passes we made of this kitchen or of this space, and we can really now connect these two and ask, "What is the delta between them? What has changed in this environment?" And in this case, um these three chairs in the middle have been displaced, and you can see when you chat with the with the asset, with your data, you can actually identify the delta and get the ground source reference to the actual capture, so you have proof of it changing.
Um so, what does this all mean? It means that you have now a building that is an AI-ready data asset. So, there's one record of what it what is there, and you
can connect it to any downstream task. So, on the left we have this conference scan that I made, and then you can now check over time any repair that needs to be happening or some maintenance or some compliance checks or insurance or maybe interior design changes or maybe even you have some robotics that you want to place there and it's like a digital twin for it to use. So, let's check the insurance. When you walk the building, when the policy starts, you have like a first initial state of the property and on based on this you can do a hyper-personalized insurance policy. And as you walk it again at renewal, you now see the delta and the upkeep and so on and the insurance policy insurance company can actually measure the performance of the property for relevant facts against its policies and give a very hyper-personalized insurance policy, which means a very efficient premium to insure such property and insure it in the right way. Uh yeah, and these are the numbers behind that. So, the business case here for the insurance for example would be that the insurance pays for what it can verify and so currently what insurers know is that one in three commercial buildings are on the books with the wrong construction class. 35% of the buildings in the specific case for example for the hurricane premium can actually get a deduction of of such percentage if it's a certified building. Certified building means it has certain compliance standards and that you can check from such an AI digital asset of the of the asset. And you also see that 70% 73% of the insurers agree that they claim fewer claims for hurricane damage if they have been checked and certified against the building. And just this is just one such certification you can do automatically with AI plus a lot of other certification and inside of the building that qualifies maybe for such programs. But yeah, all three of them essentially depend on somebody knowing the building and and the state of the building. Um and that's it. That's essentially the talk. I think that the real estate class is very big and it really needs to be transparent and there's a huge inefficiency happening day that I think with the new insights of what AI is capable to do we can make much more transparent and create a really new hyper-customized market around around assets. Thank you very much. Um if you want to find out more, please visit my website spranik.com and thank you for your attention.