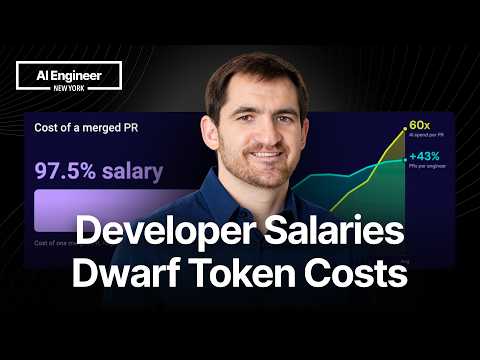
Tokens Are the Cheap Part — Steve Jamison, Jellyfish
Steve Jamison (Jellyfish) examines whether rising AI spending is offset by engineering productivity gains when developer salaries are counted alongside token costs. Using engineering data, he reports a 60-fold increase in AI spending, 43% more merged pull requests per engineer, and a 26% decline in combined cost per merged pull request. He compares heavier and lighter AI-spending organizations, examines developers' weeks with and without agent use, and treats reverts, lines of code, and PR counts as limited quality and value proxies. The talk frames management decisions around total engineering cost, output, and quality, while noting the findings are observational rather than causal.
# Channel Identity Observations: Jellyfish / Steve Jamison
## Explicit Self-Description (Creator Claims)
- **Presenter identity**: Steve Jamison introduces himself as an *"AI research and engineering leader at Jellyfish"*, repeated at both the opening and close of the video.
- **Data provenance claim**: The research is described as drawn from the *Jellyfish platform*, characterized as *"the industry's largest set of engineering workflow data joined AI telemetry data"* — a claim repeated verbatim in the outro.
- **Company role**: Jellyfish is presented as an engineering-analytics vendor; the video concludes with direct calls to action: follow on **LinkedIn**, subscribe to their **Substack**, read the **Jellyfish blog**, or *"book a demo"* on the website for help tracking *"your org's engineering workflow and AI effectiveness, including cost per merged PR."*
## Intended Audience
The content is clearly aimed at a **technical-management / engineering-leadership audience**, not individual developers or consumers:
- **Budget owners and executives**: *"These conversations involve your peers and senior leadership and the board"*; *"heading into budget season, bring cost per PR to the table."*
- **Engineering org decision-makers**: framing around org-wide metrics (merged PRs per engineer, cost per PR across company cohorts) and the question *"how do you know if you're spending enough?"*
- The speaker assumes familiarity with engineering workflows (PRs, merges, reverts, code review) and even addresses developers directly in passing: *"This is no surprise to the devs in the room."*
## Claimed Scope
- **Industry-scale benchmarking**: Company-level analysis across a study population (*"83% of the companies we studied"*, spend quintiles) plus an individual-developer study.
- **Advice genre**: The video functions as research-backed strategic guidance — a new cost-accounting framing (*"intelligence costs"* = salary + AI spend per PR) intended to reshape how organizations budget for AI.
## Demonstrated Presentation Patterns
- Data-driven argumentation style: repeated quantified claims (60x spend increase, 43% throughput gain, 26% cost-per-PR decline, quintile comparisons), with explicit acknowledgment of data limitations (*"these deltas are just slightly below the noise in the data"*).
- Balanced, non-promotional posture within a commercial context: explicitly cautions *"this isn't to say spend frivolously"* and *"we don't need AI slop mucking up the gears,"* while ultimately steering toward the vendor's product domain.
- Soft marketing funnel: the research itself is the primary value proposition, with product conversion (demo booking) positioned at the end rather than throughout.
## Boundary Notes
- The "largest dataset in the industry" and all statistics are **creator claims** from the supplied material; no independent verification is possible from this source.
- The data is dated (references to August 2026 and events in "early 2026"), which is observable but not interpretable beyond what is stated.
- No channel-wide conclusions (upload cadence, other video topics) can be drawn from this single video.
# Delivery Observations — "Tokens Are the Cheap Part" (Steve Jamison, Jellyfish)
## Speaker & Format
- Identified on camera as **"Steve Jameson, AI research and engineering leader at Jellyfish"** (opening and closing), presenting research drawn from a company dataset described as *"the industry's largest set of engineering workflow data joined AI telemetry data."*
- Delivered as a **slide-driven research talk** — the speaker references visuals ("Here we're looking at tokens used on the horizontal axis and cost per PR on the vertical axis," "we'll use these groups on the next slides").
## Recurring Vocabulary & Phrases
- **Signature thesis phrase**: *"Tokens are the cheap part"* appears at least four times — opening, mid-talk, closing summary, and final line. The talk is explicitly structured around it.
- **"Cost per PR" / "merged PRs"** — the talk's central metric vocabulary, repeated constantly and carefully distinguished: *"Not PRs created, but PRs merged."*
- **"Throughput"** as the favored framing for productivity: *"throughput gains," "PR throughput," "more throughput gains."*
- **"Curiosities"** for audience questions: *"There are two fair curiosities I get when I talk about this work."*
- **"Quintiles" / "fifths" / "heaviest fifth" / "heavy spend group"** — consistent cohort naming once introduced.
- Colloquial asides mixed with analytical register: *"Heck, even our charts show the correlation"*, *"light tokens on fire and spend with abandon."*
## Teaching & Argumentation Habits
- **Question-driven transitions**: *"How do you know if you're spending enough?"*, *"Is that good? Bad?"*, *"How are you trending?"* — rhetorical questions pivot each section.
- **Number pairing as a dramatic device**: spend vs. output tension is set up early (*"Spend is up 60x. Throughput is also up 43%."*) and resolved at the end (*"Is 60% more spend worth 43% more output?"*).
- **Anticipates objections**: hedges with *"This is not to say that org should light tokens on fire"*, and explicitly addresses *"does faster work result in worse work?"* and *"throughput driven by smaller PRs? And this is demonstrably no."*
- **Honest data caveats**: *"Though these deltas are just slightly below the noise in the data. It's not evidence of a improvement here."*
- **Callback structure**: the closing section re-answers the opening question directly (*"Back to the opening question"*) and restates the intelligence-cost thesis almost verbatim from earlier.
## Audience Engagement
- Light audience interaction: *"Raise your hand if you've rolled your eyes at verbose, unnecessary inline AI comments."*
- Speaks to a mixed technical/leadership audience: mentions *"your peers and senior leadership and the board"* and *"heading into budget season, bring cost per PR to the table."*
- Memorable aphorisms near the close: *"The bill tells you what you spent. Cost per PR tells you whether it worked."*
## Verbal Tics & Raw-Delivery Artifacts
- **Throat clearing** recurs audibly: `[clears throat]` appears at least six times, sometimes mid-sentence.
- **Self-corrections/restarts**, some suggesting transcript quirks or verbal stumbles: *"We've heard that reports of We've heard the reports of companies spending 100k"*, *"So we saw that the pop- same same as we saw in the population average"*, *"8x the tokens... a 27 25% lower cost per PR"* (final summary corrects to "8x" after saying "10").
- Occasional filler intensifiers: *"This is phenomenal"*, *"It's phenomenal"* pattern of enthusiasm spikes after data reveals.
## Stable Patterns vs. Isolated Moments
- **Stable** (repeated across the talk): the cost-per-PR framing, the cheap-tokens refrain, question-driven pivots, quintile cohort analysis, and the honest-caveat habit.
- **Isolated** (seen once, not clearly a pattern): the "raise your hand" moment; the single use of *"sloppy"*-adjacent language (*"We don't need AI slop mucking up the gears"*); the hand-off to LinkedIn/Substack/demo CTA at the end.
## Uncertainty Notes
- Tone is inferred only from transcript text; vocal warmth, pacing, and visual delivery cannot be assessed from this transcript alone.
- The doubled numbers ("27 25%", "10 8x") could be transcription artifacts or verbal corrections; cannot distinguish from the transcript alone.
# Video Position Record: "Tokens Are the Cheap Part"
**Speaker:** Steve Jamison (rendered "Steve Jameson" in transcript), AI research and engineering leader at Jellyfish
**Data basis (as stated):** Jellyfish platform data — described as the industry's largest set of engineering workflow data joined with AI telemetry data.
---
## Core Thesis
- **Tokens are the cheap part.** AI spend is a small fraction (~2.5%) of the true cost of producing merged code; developer salary (~97.5%) dominates.
- Therefore AI cost should be treated as part of the **"intelligence cost of a PR"** — salary plus AI spend in one cost bucket — not as overhead "off to the side."
---
## Framing Problem He Poses
- AI costs up **60x** year-over-year; merged PRs per engineer up **43%** over the same horizon.
- He explicitly calls this a **tension**: "How do you reconcile them? ... Is that good? Bad?"
- Open questions he raises: Are you spending enough? Should spend increase 50% or 2x? What happens if you cap use — saving money or blocking efficiency gains?
- He dismisses peer-benchmarking of raw bills as inadequate: comparing one company's bill to another's "can't tell the story."
- He claims both numbers together **leave out the biggest cost: developer salary.**
## Key Quantitative Claims
- **Cost per merged PR fell 26%** over the last year (August 2026 data), *including* the 60x AI cost increase. Review time and quality gates factored in.
- **83% of companies studied** showed a drop in cost per PR.
- AI is ~**2.5%** of cost to produce a merged PR; salary is ~97.5%.
- **Spend quintiles:**
- Lightest fifth: ~0.3% of PR cost is AI (~60M tokens/dev/month).
- Heaviest fifth: ~8.5% of PR cost (~2.5B tokens/dev/month) — about two orders of magnitude more.
- **Throughput by spend group:** bottom four-fifths gained ~40%; heaviest fifth gained **67%**.
- **Cost per PR by spend group:** heaviest fifth dropped **32%**; others ~25%.
- **Top 10% of company-months:** 8x the tokens vs. median, **25% lower cost per PR**.
## Developer-Level Study
- Comparing each developer's heavy-token weeks to their own lighter weeks: ~2x token spend, **27% more PRs merged**, each PR ~**18% cheaper** (salary + tokens combined).
## Addressed Objections
- **Does faster mean worse?** Uses PR reverts as a proxy. Revert rates dropped slightly for every group, but he qualifies: the deltas are "just slightly below the noise in the data — it's not evidence of an improvement." He concludes only that there are no worrying signs of severe quality issues, **not** evidence of quality improvement.
- **Are gains from smaller PRs?** "Demonstrably no." Lines of code per PR are increasing. He cites verbose AI comments, irrelevant tests, low creation barriers, and the pull to do more per PR — and notes this "doesn't mesh well with the PR review stress folks are feeling these days." He concedes the talk does not dig into what drives the lines-of-code change.
## Recommendations
- Track AI spend and throughput, but as **supporting metrics**; the driving metric should be **cost per PR**.
- Diminishing returns are real (steep early gains, flattening curve) but "diminishing returns is not the same as no returns"; he says most companies are "not close to that threshold" where tokens stop being cheap.
- Explicitly **not** advocating frivolous spend: watch for runaway jobs, track spend — just don't make it the driving metric.
- Watch reverts and quality metrics as a "counterweight" ("We don't need AI slop mucking up the gears").
- For budget season: "The bill tells you what you spent. Cost per PR tells you whether it worked. And right now, for most companies, it says keep investing."
---
## Qualifications and Tensions Preserved
- "Diminishing returns" acknowledged but reframed as still-positive returns.
- Quality claim is deliberately weak (absence of bad signals, not proof of improvement).
- He concedes a future where "tokens aren't the cheap part" — the claim is time-bound and current-conditions-bound.
- Mechanism driving increased lines of code per PR is left unresolved ("beyond this talk").
- Revenue/quality of merged PRs beyond revert rates is not addressed; "cost per PR" is his chosen summary ratio, presented as the answer to the 60x-vs-43% question, which cannot be answered "in isolation" by his own framing.
# Video Attribution & Provenance Record
## Speaker Identification
| Speaker | Role | Basis |
|---|---|---|
| **Steve Jamison** (spelled "Steve Jameson" in transcript) | AI research and engineering leader at **Jellyfish**; sole presenter/creator | Self-introduction at opening and closing |
- Single-speaker video; no guests, interviewers, or narrator identified. Intermittent non-speech sounds (coughs, throat clearing) are present in the transcript with no attributed second speaker — attribution unknown, likely incidental audio.
## Cited / Referenced Sources
- **Jellyfish platform data** — presenter states: *"The research that I'll present is drawn from the Jellyfish platform"* — described as "the industry's largest set of engineering workflow data joined AI telemetry data."
- Data timestamp: figures stated as **"from August 2026."**
- **Unspecific third-party claims:**
- Industry reports of companies spending "100k, 500k, even millions on AI" and resetting budgets (source not named).
- "Other reported figures" for the ~2.5% AI share of PR cost (sources not named).
- "Plenty of research and anecdotal data" linking AI coding to throughput gains (sources not named).
- No citations with verifiable named studies, papers, or organizations beyond Jellyfish's own data.
## Key Claimed Findings (attribution: presenter / Jellyfish data)
- AI costs up **60x** year-over-year; merged PRs per engineer up **43%**.
- Dollar cost per merged PR **down 26%** over the year; **83%** of studied companies showed a decline.
- AI ≈ **2.5%** of cost per merged PR; salary ≈ **97.5%** ("intelligence cost" framing).
- Quintile analysis: heaviest-spend group (~2.5B tokens/dev/month) vs. lightest (~60M tokens/dev/month).
- Heavy spenders: **67%** throughput gain, **32%** cost-per-PR decrease vs. ~40% / ~25% for peers.
- Developer-level study: heavy token weeks → 2x token spend, **27%** more merged PRs, **18%** lower cost per PR.
- Quality proxies: revert rates flat/slightly down (deltas "just slightly below the noise"); PRs not smaller — lines of code per PR increasing.
## Promotional Segments — FLAGGED
- **Closing promotional block:** invites viewers to follow Jamison/colleagues/Jellyfish on LinkedIn, subscribe to Jellyfish's **Substack**, read the **Jellyfish blog**, and **book a demo** on the Jellyfish website for tracking engineering workflow and AI effectiveness. Explicitly promotional for Jellyfish's commercial product.
- Opening framing of Jellyfish data ("industry's largest") functions as implicit promotion of the platform.
## Availability & Channel Notes
- Availability of comments, external links, or the Substack/blog URLs cannot be confirmed from the transcript — only referenced verbally.
- Transcript contains transcription artifacts (e.g., "river reverts" likely = "PR reverts"; inconsistent name spelling) — recorded as transcript-quality uncertainty, not content judgment.
## Evidence Channels Unavailable
- Slides/charts referenced ("our charts show the correlation," quintile slides) are not present in the transcript — visual evidence not verifiable.
- No named external studies; third-party claims rest on presenter assertion.
Hi, I'm Steve Jameson, AI research and engineering leader at Jellyfish. I'm here to show you why tokens are the cheap part. The research that I'll present is drawn from the Jellyfish platform. The
industry's largest set of engineering workflow data joined AI telemetry data. It's no secret that AI costs are climbing. They're up 60x from this time last year. The use cases are wide and varied. The models and harnesses are getting much better. The implications are exciting. But discussions around budget and spend are not as much fun. These conversations involve your peers and senior leadership and the board. Not always the easiest audiences, especially when you don't have the right data. And it's real money these days. Output is up, too. Merged PRs per engineer are up 43% over the same one-year horizon. This is phenomenal. We've not seen productivity inputs like this, especially on this time scale. There's plenty of research and anecdotal data to know that AI and AI-driven coding are driving these throughput gains. Heck, even our charts show the correlation. Notice where the inflection points are. AI spend increased in early 2026 when throughput gains start a steady increase of their own. There's a tension with these two numbers, though. How do you reconcile them? Spend is up 60x. Throughput is also up 43%. Is that good? Bad? 43% is a big number. But so is 60x. How do you know if you're spending enough? Is there more productivity gain locked behind a checkbook? Should we increase spend 50%? 2x more? Or how do you know if you spent too much? I'm sure many of you have felt the tension here. The CFO or board are asking for the receipts of the spend. Can you show them? Well, merge PRs are up 43% satisfy them? Also, what happens if you cap use and spend? Are you stopping from setting tokens on fire? Or are you stopping further efficiency gains? You can ask peers at other companies what they're paying. For many, it's still a moving target though. But, how do you equate that to your org? Surely, just comparing their bill to yours is inadequate. We've heard that reports of We've heard the reports of companies spending 100k, 500k, even millions on AI. Setting then resetting their AI budgets as reality sets in. Ultimately, these two numbers can't tell the story.
And even together, they miss the biggest line on the cost side. These two numbers leave out the biggest cost of all, developer salary.
AI is making developers more productive on a scale we haven't seen before. It isn't just another tool, it's intelligence. This intelligence dramatically changes how much each dev can produce. That's why we need to think about its cost differently. Not off to the side as overhead, but it's part of what it takes to produce each PR. We're going to call this intelligence costs of a PR. What you pay your engineers plus what you pay for AI. Put them together in one cost bucket. AI is about 2 and 1/2% of the cost to produce another unit of merged code. Salary is the other 97 and 1/2%. This is in line with other reported figures, and this data is from August 2026. Here, tokens are the cheap part. But, that's current relative costs, not dollars. Let's look at what happened to the cost of a merged PR over the last year. \>\> \[clears throat\] \>\> The dollar cost of a merged PR fell 26%
over the last year. Not PRs created, but PRs merged. Review time is factored in, and some level of quality gates has been cleared.
What That decline in cost per merged PR includes a 60x increase in AI costs over the same time frame. The change is nearly universal, too. 83% of the companies we studied showed a drop in cost per PR. What does this tell us? The additional throughput gains are being spread or are \[clears throat\] spreading salary thinner across PRs, and this is happening faster than the AI costs are increasing. What's the range in token spend? We ranked companies
by token usage, then grouped them into quintiles or fifths. The range here is quite large. The lightest group, about 0.3%
of the cost of a PR is is AI. This represents about 60 million tokens per dev per month. The top 20% of AI spend per dev, we're going to call the heaviest spend group. There, 8 and 1/2% of the PR costs is AI. This represents about 2.5 billion tokens per dev per month. About two orders of magnitude more than the lightest group. We'll use these groups on the next slides to see how token spend influences other metrics. First, PR throughput measured as merged PRs per dev. Split by the same AI spend quintiles on the previous slide. The bottom 4/5 of spenders saw PR throughput gains of around 40% give or take. But the heavy spend group improved more at a 67% increase. More AI spend led to more throughput gains. Now let's look at the cost per PR. Positive results are seen again across the board. Cost per PR is dropping for all AI usage groups. However, again, the heaviest fifth so the the companies that spent the most improved the most. They saw a cost per PR decrease of 32% over the last year. The other four groups saw about a 25% decrease in cost per PR. Investing in spending more on AI fueled more of an improvement in cost per PR compared to peers who leaned in less. So we saw that the pop- same same as we saw in the population average, cost per PR changes are driven largely by PR throughput, not by AI spend. The heavy spenders experienced PR throughput gains of 67% compared to about 40-ish percent for their peers. Spreading the same salary across more PRs in the month has more of an effect than the rising AI costs because tokens are the cheap part. This is not to say that org should light tokens on fire and spend with abandon. Here we're looking at tokens used on the horizontal axis and cost per PR on the vertical axis. There's a steep drop at the beginning where relative small AI spend results in large gains initially. As token usage increases, the cost per PR improvement decreases. This is diminishing returns. I want to stress though, diminishing returns is not the same as no returns. We're seeing that the top 10% are spending 8x the tokens compared to the median and achieving a 27 25% lower cost per PR. There will be a time when tokens aren't the cheap part, but by and large for most companies out in the wild we're not close to that threshold. More tokens leads to more PRs, which leads to a lower cost of delivery.
So far we've talked about companies. Next I'd like to take a tangent and talk about a study we did with developers. Here we looked at developer weeks with
heavy token use compared to the same developer weeks with lower token use. \>\> \[cough\] \>\> Here we saw the same phenomenon just at the individual level. Compare each developers heavy agent skill weeks with their own weeks without skills. They spend about twice as much on tokens, merged 27% more PRs, and reach PR and each PR costs about 18% less once salary and tokens are counted together. There are two fair curiosities I get when I talk about this work. First, does faster work result in worse work? And second, are the more PRs the throughput gains that we're seeing, are they being driven by smaller chunks of work? First curiosity is cheaper, faster work,
worse work? If AI makes PRs faster and cheaper, are we just shipping more mistakes? One proxy for this is river reverts. Merged PRs that undo an earlier PR.
The heaviest fifth started lowest before most of the token growth, and revert rates drop slightly for every group. Though these deltas are just slightly below the noise in the data. It's not evidence of a improvement here. However, more importantly, we're not seeing any worrying signs of rampant or severe quality issues with higher token spends and faster PR throughput.
My second curiosity is throughput driven by smaller PRs? And this is demonstrably no. Not smaller PRs. In fact, AI is driving
an increase in line level lines of code generated per PR. This is no surprise to the devs in the room. Raise your hand if you've rolled your eyes at verbose, unnecessary inline AI comments, or a file full of mostly irrelevant tests. Gen AI Gen AI likes to generate code. Also, the bar to create is low for devs, and there's a pull to do more per PR instead of spinning up another ticket. It's just one, maybe two prompts, and I'll handle this edge case, or I can combine this and that element. Fewer PRs to wrangle. This doesn't mesh well with the PR review stress folks are feeling these days, though. There's \>\> \[clears throat\] \>\> Also, AI is just becoming more capable, so we're getting more ambitious. It is beyond this talk to dig into what's actually driving those level of lines of code changes. However, the increase in PR throughput is not coming from smaller PRs. This is intuitive for most, but it's still good to verify. Back to the opening question. Is 60% more spend worth 43% more output? You can't tell in isolation. You should track both. They are important numbers, but they're supporting metrics. AI spend per PR is the intelligence that you're buying as a resource to help make your devs go faster. PRs per engineer is what you're getting with that spend. However, looking at those hides the trade-off. \>\> \[clears throat\] \>\> At but put salary into the equation and take the ratio of cost to throughput, and there you get your answer. Cost per PR is down 26% over that same time period. It's clear AI is driving cost efficiencies despite the increasing bills. And the AI the AI spend needed to get those efficiencies is small, relatively speaking. AI is still a sliver of what a PR costs. Two and a half percent on average. Under 10% for the heavy spender group. Tokens are the cheap part. \>\> \[clears throat\] \>\> In the range that we see, more spend kept paying. Heavier token users saw 67% PR throughput gain compared to 40% for their lower spend peers. This drove cost per PR down 32% compared to about 25% for the lower spend peers. Looking at the PR cost to token ratio curve, the top 10% of company months by token usage resulted in 10 8x the tokens, but 25% lower cost per PR compared to the median. AI is making developers more productive on a scale we haven't seen before. It isn't just another tool, it is intelligence, which changes how much each dev can produce. That's why we need to think about its cost differently, not off to the side as overhead, but part of what it takes to produce each PR. You need to add the AI spend and the human spend the human salary spend together to calculate your real costs per PR.
This isn't to say spend frivolously. Sure, you should watch for runaway jobs. You should track your AI spend. I'm not
saying don't look at how much AI is going how much AI spend is going in each PR. I'm saying don't let that be your driving metric. A new framing might steer how and when you think about other investments, like integrating model routers, post-training your own model, implementing token limits, etc. Will you get more efficiencies out of trying to control AI costs or by continuing to invest in things that increase throughput, like more AI enablement? Either way, track the total intelligence costs, human plus artificial, per PR every month. Next to that AI bill and next to the PR throughput. How are you trending? Is throughput continuing to improve? What about those cost efficiencies, the cost to deliver? Watch reverts and quality metrics beside all of this as a counterweight. We don't need AI slop mucking up the gears. So, heading into budget season, bring cost per PR to the table. Not just your token bill, not just the throughput bump. The bill tells you what you spent. Cost per PR tells you whether it worked. And right now, for most companies, it says keep investing. \[clears throat\] Tokens are the cheap part to get efficiency gains. Well done. You made it to the end. Here's how you can stay up to date with our latest research, which again draws from the largest engineering workflow and AI telemetry data set in the industry. You can follow me on LinkedIn, my colleagues, or Jellyfish. Subscribe to our Substack, or you can check out our Jellyfish blog on the website. If you want help tracking your org's engineering workflow and AI effectiveness, including cost per merge PR, go to our website and book a demo, or reach out to me and I'll get you connected to the right folks. Again, I'm Steve Jameson, AI research and engineering leader at Jellyfish. Thanks for watching. Cheers.