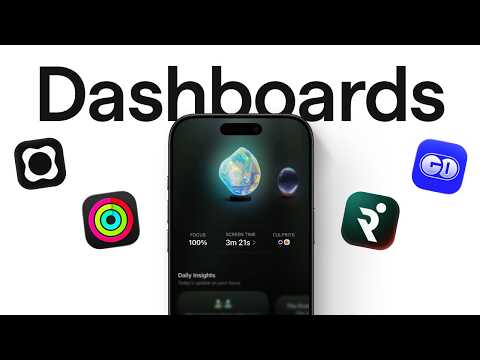
I Studied 2,108 Dashboards To See What Sticks
An analysis of dashboard design based on a study of 2,108 dashboards across 536 apps and websites, looking past common UI advice like spacing and grids to identify deeper patterns behind dashboards that feel clear rather than overwhelming. The video examines SaaS, finance, health and fitness, and AI products, citing examples from apps including Shopify Live View, Mercury, ClickUp, Duolingo, Oura, Apple Fitness, and GitHub. Chapters cover signals, anticipation, breaking the mold, the pitch, coining metrics, and where dashboards are heading. A written version with charts is available at the Mobbin blog (mobbin.com/blog/what-good-dashboard-design-looks-like).
# Channel Presentation Observations — "I Studied 2,108 Dashboards To See What Sticks"
## Intended Audience
The channel clearly addresses **product/UX designers**, evidenced by multiple specific references:
- "tens of thousands of designers come on Mobbin searching for the same thing. Dashboards, mostly web ones."
- "AI dashboards get about twice the saves and exports of the average dashboard screen. It reveals that designers are actively collecting these as references."
- The framing "Dashboards are the designer's dream selfie" assumes a design-literate viewer.
The tone also speaks to practitioners making product decisions, not just craft-level designers:
> "When we're choosing between Shopify and 10 other platforms that do roughly the same thing, the dashboard does a lot of the convincing."
## Claimed Scope
- **Research-driven design analysis at scale**: the title and opening claim a study of "2,108" dashboards; closing: "Thousands of dashboards later, I keep going back to that one simple gut check."
- **Named product examples** span consumer and B2B: Faith, Origin, Runner, Shopify (Live View), Visitors, Front, Cake, Mercury, Opal, Orbit, Duolingo, Oura, Apple — suggesting claimed scope across the design landscape rather than one vertical.
- **Data-backed assertions** about the platform Mobbin ("nearly one in five products on Mobbin have their dashboard as the home screen"), positioning the creator as having access to aggregate design reference data.
## Self-Description & Series Evidence
- The channel self-presents as an **episodic research series**:
> "We've also studied thousands of onboarding flows to find out what works."
> "we are actively working on a video on paywalls. So, subscribe so you don't miss it."
- The collective "we" implies a team/studio identity, though the material does not name the channel.
- The channel's demonstrated **methodology**: large-sample analysis (2,108 dashboards, "thousands of onboarding flows"), pattern extraction, and distillation into heuristics ("Would I screenshot this, and why?").
## Observable Presentation Patterns
- **Historical/etymological storytelling** as a rhetorical device (the "dashboard" carriage-board origin story) — a demonstrated style of blending design critique with narrative context.
- **Explicit takeaway framing**: patterns are labeled ("The other pattern was visual," "That's the gap AI is filling") for scannability.
- **Call to action** for subscription and series continuity appears in the closing lines.
## Claims vs. Demonstration
- *Creator claims*: studied 2,108 dashboards; Mobbin usage statistics; AI dashboard save/export multiples.
- *Demonstrated by the material itself*: a curated set of dashboard examples illustrating insight-forward, visually distinctive, gamified, proprietary-metric, and AI-assisted patterns — supporting the claim of a broad comparative study, though the underlying dataset is not shown.
# Delivery Observation Report
**Video:** "I Studied 2,108 Dashboards To See What Sticks"
## Tone & Register
- **Conversational, first-person authority.** The narrator grounds claims in personal labor: *"I went through 2,108 of them"* and *"Thousands of dashboards later, I keep going back to that one simple gut check."*
- **Casual asides create a speaking rhythm:** *"Fair."* (after "the designer's dream selfie"), *"look, the obvious stuff is all there."*
- **Blunt, punchy openers:** *"Most dashboards look identical. They work, but they don't stick."*
## Recurring Phrases & Motifs
- **"Stick/sticks"** is the central vocabulary anchor — appears in the title, *"they work, but they don't stick"* [0], and *"To See What Sticks."*
- **"Keep coming back"** recurs: *"tens of thousands of designers come on Mobbin searching"* [12], *"The ones I kept coming back to"* [45], *"I keep going back to that one simple gut check"* [268].
- **"One step ahead" / "stands out" / "stood out"** — a consistent differentiator framing: *"they're always one step ahead"* [45], *"Being this clean stands out"* [102], *"dashboards that stood out to me"* [176].
## Teaching Habits
- **Concrete product examples as evidence.** Nearly every claim is anchored to a named product: Faith, Origin, Runner, Shopify, Visitors, Front, Cake, Mercury, Opal, Orbit, Duolingo, Oura, Apple.
- **Micro-explanations with "instead of" contrast structure:**
> *"Instead of just a line chart, Faith puts the key insights next to it."* [45]
> *"Instead of showing an empty table after you've paid all your bills, Mercury lets you play a game."* [112]
- **Etymology as narrative device:** the dashboard word-history segment (*"it was literally a wooden board on a horse carriage"*) is a longer digression used to reinforce the thesis — *"The form keeps changing. The job never changed."* [145–155]
- **Question-led engagement:** *"would you remember any of them?"* [45], *"So, why do people keep coming back?"* [12], *"Would I screenshot this, and why?"* [268].
## Structural Patterns
- **Short declarative sentence chains:** *"Every dot is a real person browsing your store somewhere right now."* / *"Once that happens, it's very unlikely that this person would change."*
- **Quantified credibility claims:** *"2,108 of them," "one in five products on Mobbin," "about twice the saves and exports."*
- **Closing formula:** a distilled gut-check takeaway (*"Would I screenshot this, and why?"*) followed by cross-promotion of upcoming episodes (*onboarding flows, paywalls*) and a subscribe call-to-action.
## Uncertainty Notes
- The delivery includes music cues and what appears to be a second voice/music transition marker (*">> [music] >>"* at [45] and [91]); whether these indicate a co-narrator cannot be confirmed from the transcript.
- Single-video sample: whether the "instead of" contrast or question-led hooks are stable habits across the channel is not verifiable here.
# Observation Record: "I Studied 2,108 Dashboards To See What Sticks"
**Source basis:** Transcript only. The primary speaker is an unnamed narrator (no speaker metadata provided; apparent author/host of the video based on first-person framing).
---
## Core Claims by the Narrator
### On the sameness of dashboards
- **Claim:** Most dashboards look identical — they "work, but they don't stick."
- **Reasoning stated:** Templates are everywhere and AI can generate one in seconds, yet tens of thousands of designers daily search Mobbin for dashboards (mostly web ones). The recurring demand suggests dashboards serve a deeper appeal.
- **Claim:** Dashboards are "the designer's dream selfie" — visually impressive, complex enough to flex, and fitting in one screenshot. The narrator marks this judgment with *"Fair."*
- **Evidence cited:** After reviewing **2,108 dashboards**, the narrator reports the obvious qualities (clear hierarchy, good spacing, useful charts) are all present, but poses the retention test: *"if I close this right now, would you remember any of them?"*
### Patterns among memorable dashboards
- **Insight-forward design:** Instead of a plain line chart, the narrator cites **Faith** placing key insights next to the chart — "It doesn't just show you what happened. It shows you what to do about it."
- **Digestible recaps:** **Origin** (weekly recap, daily market brief) and **Runner** (post-run stat highlights that create a sense of accomplishment).
- **Distinctive visuals:**
- **Shopify's live view** — real-time global visitor monitoring; "Every dot is a real person browsing your store somewhere right now."
- **Visitors** (web analytics tool) — cleanliness stands out against typically busy dashboards.
- **Front** — heat map where darker squares indicate busier hours.
- **Cake** — a literal birthday cake inside an ownership donut chart.
- **Mercury** — after all bills are paid, an empty table is replaced by a playable game.
- **Authorship inference (explicitly framed):** "You can tell these weren't templates. Someone sat down and thought, 'How do I actually make this data make sense to my users so they get it instantly?'"
### On dashboards as commercial assets
- **Claim:** "Sometimes we're also buying the dashboard."
- **Supporting reasoning:** Nearly **one in five products on Mobbin** uses a dashboard as its home screen. When choosing between Shopify and comparable platforms, "the dashboard does a lot of the convincing" — one screenshot conveying what the product does, how you're doing, and what to do next.
- **Etymology aside:** "Dashboard" originally meant a wooden board on horse carriages blocking mud (~200 years ago), later becoming the car's signal display — "The form keeps changing. The job never changed."
### Mobile-first and branded metrics
- **Claim:** Many standout dashboards were mobile.
- **Opal** — screen time insights formatted like an Instagram story; "You swipe through your own data like it's content." The narrator adds: "When something looks this good, people are bound to share it."
- **Orbit** — makes subscription tracking "weirdly enjoyable."
- **Proprietary metrics claim:** Some products coin their own metrics — **Duolingo** (streaks), **Oura** (readiness score), **Apple** ("I closed my rings"). The narrator argues that once a user adopts this vocabulary, switching to another fitness tracker becomes very unlikely.
### AI integration
- **Claim:** The gap of staring at a spike wondering "Why? What changed?" is "the gap AI is filling" — from a single prompt under a chart to a full conversational AI layer alongside the data.
- **Evidence cited:** On Mobbin, **AI dashboards get about twice the saves and exports** of the average dashboard screen, which the narrator says shows designers actively collecting them as references.
### Concluding heuristic
- **Gut check:** *"Would I screenshot this, and why?"*
- **Claim:** The dashboards worth screenshotting "weren't the prettiest ones. They were the ones that knew what to leave out, and they just happened to look good doing it."
### Forward-looking notes (promotional)
- Upcoming episode on **onboarding flows**, with the stated finding that "an effective onboarding flow isn't about keeping it short."
- A video on **paywalls** is in active production; viewers are urged to subscribe.
---
## Qualifications and Tensions Preserved
- The narrator acknowledges competent-but-forgettable dashboards are "perfectly fine" — the critique is about memorability, not correctness.
- The "designer's dream selfie" framing is self-qualified with "Fair," acknowledging the vanity motive without dismissing it.
- The "weren't templates" judgment is presented as an inference from visible design ("You can tell…"), not verified fact.
- The claim that good-looking data is "bound to" be shared is stated as expectation, not measured outcome.
---
## Unverified / Source-Limited Notes
- No speakers are identified in the metadata; all claims are attributed to the unnamed narrator's narration.
- Figures (2,108 dashboards, one-in-five Mobbin products, 2× saves/exports) are reported by the narrator without underlying methodology shown in the transcript.
# Video Attribution & Provenance Record
## Speaker Attribution
### Primary Speaker
- **Narrator / host (unnamed)** — speaks throughout in first person ("I went through 2,108 of them"). No name, title, or channel identity is given in the transcript or metadata.
- **Role:** creator-narrator; presents research findings directly to camera.
### Other Voices
- No guest speakers, interviewees, or named experts are identified. Transitions such as `>> [music]` suggest music or edit markers, not attributed second speakers.
### Attribution Limitations
- Speaker identity (name, channel, credentials) is **not established** by the transcript or supplied metadata.
## Referenced Products, Sources & Claims
### Data Claims (Attributed to the Narrator Only)
- Studied **2,108 dashboards** (source/methodology not specified beyond "went through them").
- "Tens of thousands of designers come on Mobbin" searching for dashboards daily.
- "Nearly **one in five products** on Mobbin have their dashboard as the home screen."
- "**AI dashboards get about twice the saves and exports** of the average dashboard screen" on Mobbin.
### Third-Party Products Referenced
| Product | Claim Made |
|---|---|
| **Mobbin** | Design reference library; source of usage statistics |
| **Faith** | Places key insights next to charts |
| **Origin** | Weekly recap, daily market brief |
| **Runner** | Packages run stats into highlights |
| **Shopify** | Live view monitoring store visitors globally |
| **Visitors** | Clean web analytics tool |
| **Front** | Heat map of busy hours |
| **Cake** | Birthday cake in ownership donut chart |
| **Mercury** | Playable game after paying bills |
| **Opal** | Screen time insights as Instagram-story-like format |
| **Orbit** | Subscription tracking |
| **Duolingo** | Coined "streaks" metric |
| **Oura** | Readiness score |
| **Apple** | "Closed my rings" metric |
### Historical Claim
- Narrator states the word **"dashboard"** originally referred to a wooden board on horse carriages (~200 years ago) blocking mud — no cited source.
## Promotional Segments — 🚩 Flagged
- **Channel self-promotion (end of video):**
- Upcoming **onboarding flows** study mentioned as prior work.
- Next episode teaser: a video on **paywalls** ("we are actively working on").
- **Call to action:** "subscribe so you don't miss it."
## Availability & Evidence Limits
- No curated metadata supplied beyond the title — no channel name, publication date, or description.
- No comment section availability information present.
- All statistics trace only to the narrator's unverified statements; no cited papers, reports, or links appear in the transcript.
Most dashboards look identical. They work, but they don't stick. Templates are everywhere. AI can generate one in seconds. And yet, every day, tens of
thousands of designers come on Mobbin searching for the same thing. Dashboards, mostly web ones. So, why do people keep coming back? Dashboards are the designer's dream selfie. Visually impressive, complex enough to flex, and fits perfectly in one screenshot. Fair. I went through 2,108 of them, and look, the obvious stuff is all there. Clear hierarchy, good spacing, useful charts. These are perfectly fine dashboards. But, if I close this right now, would you remember any of them? \>\> \[music\] \>\> The ones I kept coming back to, they're always one step ahead. Instead of just a line chart, Faith puts the key insights next to \[music\] it. It doesn't just show
you what happened. It shows you what to do about it. Origin shows you your weekly recap in a way that's easy to understand, along with a daily market brief with valuable insights.
After a run, Runner packages your stats into highlights that give you a sense of accomplishment. The other pattern was visual. Most dashboards look the same. But, then
you see something like Shopify's live view. It lets you monitor store visitors across the globe in real time. Every dot is a real person browsing your store
somewhere right now. \>\> \[music\] \>\> Visitors is a web analytics tool. Most dashboards tend to look busy. Being this clean stands out. Front uses a heat map where darker squares just mean busier hours. Cake \[music\] put a literal birthday cake inside their ownership donut chart. Instead of showing an empty table after you've paid all your bills, Mercury lets you play a game. You can tell these weren't templates. Someone sat down and thought, "How do I actually make this data make sense to my users so they get it instantly?" I think sometimes we're also buying the dashboard. The word dashboard originally
had nothing to do with data. Nearly 200 years ago, it was literally a wooden board on a horse carriage used to block mud and horse poop
when the horse dashed forward. As cars replaced carriages, dashboard became the place for signals. The form \[music\] keeps changing. The job never changed. Today, nearly one in five products on Mobbin have their dashboard as the home \[music\] screen. When we're choosing between Shopify and 10 other platforms that do roughly the same thing, the dashboard does a lot of the convincing. One screenshot that tells you exactly what this product does, how you're doing, and what to do next. A lot of the dashboards that stood out to me were on mobile. Opal turns screen time insights into a format like Instagram story. You swipe through your own data like it's content. When something looks this good, people are bound to share it. Orbit makes tracking subscriptions weirdly enjoyable. And then there's this whole thing where some products start coining their own metrics. Duolingo made streaks a thing.
Oura gives you a readiness score. Instead of saying, "I worked out for 30 minutes today," an Apple user might just say, "I closed my rings." Once that happens, it's very unlikely that this
person would change to another fitness tracker. We've all had a moment staring at a dashboard asking, "Why? What changed?
What caused this spike?" That's the gap \[music\] AI is filling. Sometimes as subtle as a single prompt right below your chart, \[music\] or a full AI layer you can talk to right
alongside your data. On Mobbin, AI dashboards get about twice the saves and exports of the average dashboard screen. It reveals that \[music\] designers are actively collecting these as references. Thousands of dashboards later, I keep going back to that one simple gut check. Would I screenshot this, and why? Because the dashboards that I would screenshot weren't the prettiest ones. They were the ones that knew what to leave out, and they just happened to look good doing it. We've also studied thousands of onboarding flows to find out what works. Turns out an effective onboarding flow isn't about keeping it short. In the next episode, you're going to love this because we are actively working on a video on paywalls. So, subscribe \[music\] so you don't miss it.